As seen in


Simple start
Simplified investing
Guided support

Financial flexibility
No hidden fees
Penalty-free withdrawals¹

Easy to try
Cancel anytime²
30 day free trial


See how their account could grow
Move the sliders to see how your child’s account might grow with them through the years. It’s a powerful way you could help them achieve their financial dreams!
$30,270
Monthly contributions
$30
Monthly gifts from others
$50
Years to grow
18
Average annual return
7%
A lifetime of possibilities
An account that grows with them, from childhood into adulthood. By investing for them when they’re young, the money you put in can add up over time and be withdrawn whenever they need it, to help them achieve their dreams.
Tuition
Art classes
Band uniforms
Sports equipment
Tutoring
Any child-related expense
House
Wedding
Baby expenses
Retirement
Emergency
Anything else!
Comparison to a 529 plan?
How does this account grow?
What about withdrawals?
For education...and beyond
Our custodial accounts are UGMA (“Uniform Gift to Minors Act”) accounts. Unlike a 529 plan, which is restricted to qualified education expenses, a UGMA investment account can be used for anything that benefits your child—no matter if it’s when they’re minors, in college, or beyond.
Education
Sports equipment
Travel
First car
Wedding
Mortage
Retirement

Yes! Having both a 529 and a UGMA investment account is a great way to set your child up for financial success at any stage of their life.

Accounts will transfer to your child when they reach an age of majority (varies by state, typically 18-21 years old).

Tax advantages*
In most cases for UGMA custodial accounts, there are no taxes paid each year, or taxes will be much less than in a standard investment account.* See FAQ section for additional details.

First $1,350
Tax-free
Next $1,350
Taxed at the child’s rate
Beyond
Taxed at the parent’s rate
Here’s an example:

Johnny’s account earned $1,500 this year.
How much would he pay in taxes?
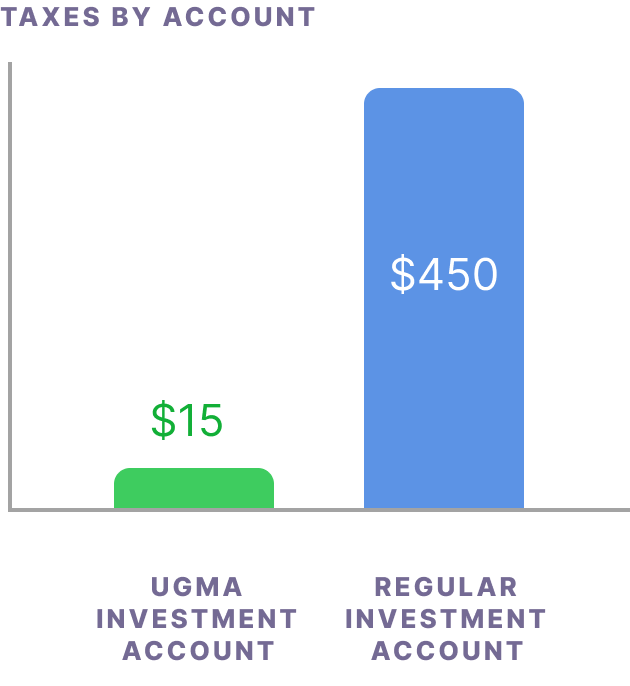
Assumes that Johnny is in the lowest tax bracket (10%). Regular investment account would be taxed at the parents’ bracket (30% in this example).
Assumes that Johnny is in the lowest tax bracket (10%). Regular investment account would be taxed at the parents’ bracket (30% in this example).
Big dreams, small fees
You get all this with your account for only $3/mo.²
More than one account? It’s only $5/mo, flat.
Just $3/mo covers:
SIPC-protection up to $500k
Professionally managed portfolios
All trading fees & more²

Flat fee
No commissions
No charges based on percentage of your assets

A trusted way to invest in their futures
Our investment accounts are known as UGMAs. UGMA accounts have been around since the 1950’s and are a trusted way to invest in your child’s future.
Asset management
Flexible portfolios
Security and privacy
 protected up to $500k
Got questions? We’ve got answers.
What is a UGMA kids investment account?
When can my child legally access their account?
What are the UGMA tax benefits?*
What can the money in this account be used for?
What is the difference between a UGMA and a 529 account?
Who is W&S Advisory Services and what is their role?
How much does this cost?
What information will I need to open an account?
How can I contribute to my child’s account?
Is there a minimum amount I need to contribute?
Does this account earn interest?*


© 2026 Gerber Life Agency, LLC


